
2020 turned out to be quite a year, and it’s far from over. With the help of our partners at FraudScore, we’ve compiled a report on fraudulent advertising traffic in 2020.
About FraudScore
FraudScore is a third party independent antifraud solution provider. The company was established in 2016 and specializes in preventing and fighting ad fraud. The solution covers antifraud demands for the majority of marketing campaigns — programmatic, CPM, CPC, CPI and CPA.
FraudScore clients are direct advertisers, ad networks, developers and ad agencies from all over the world. The traffic that FraudScore platform receives is very diverse in campaign types and geos. So with their help and guidance we’ve tried to understand as much as we could about fraud in advertising in 2020.
When and how much?
Through 2020 FraudScore has been monitoring and analyzing advertising traffic from variety of sources.
All traffic
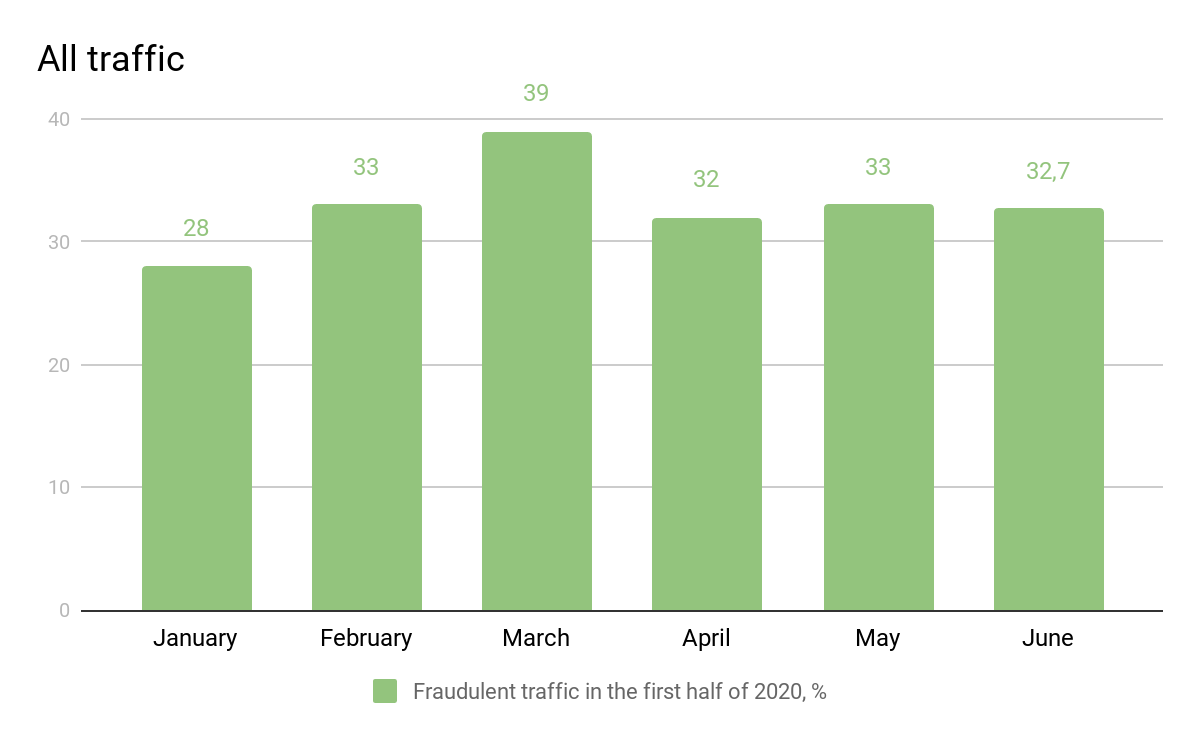
- FraudScore platform has detected 33% of ad fraud during Jan-Jun, 2020 on average. Comparing to the same figure in Jan-Jun, 2019 — the 2020 numbers look better — 35% in 2019.
- But if we take a look at the detected fraud by months in 2020, we can see the difference and the clear trend of growth of ad fraud during the global pandemic.
- January had 28% of ad fraud. This number was giving marketers some good vibes and hopes for the amount of ad fraud to drop at least a little from 31% in 2019. But then came the pandemic.
- The biggest amount of ad fraud in global traffic was detected in March (39%) — the peak of the pandemic, when almost all the major global geos were on a total lock down.
- April, May and June (Q2, 2020) show almost the constant number of 33% — the figure that is equal to February numbers. Users all over the world were either already adapted to the new realities or started to see restriction measures lifted. It looks like we won’t really see a figure at least less than 33% of fraud in 2020 at all.
- In all processed traffic — attribution fraud, detected proxy and anomalies were the most detected fraud types.
- Device fraud has become one of the most widespread fraud type starting since March 2020, when fraudsters have started to put more efforts into mobile campaigns disruption. It means that fraudsters use device emulators, fake devices, adware etc to fake real users devices.
We will discuss fraud methods a little later, for now let’s see what regions were the most affected platforms and geos.
Mobile Traffic
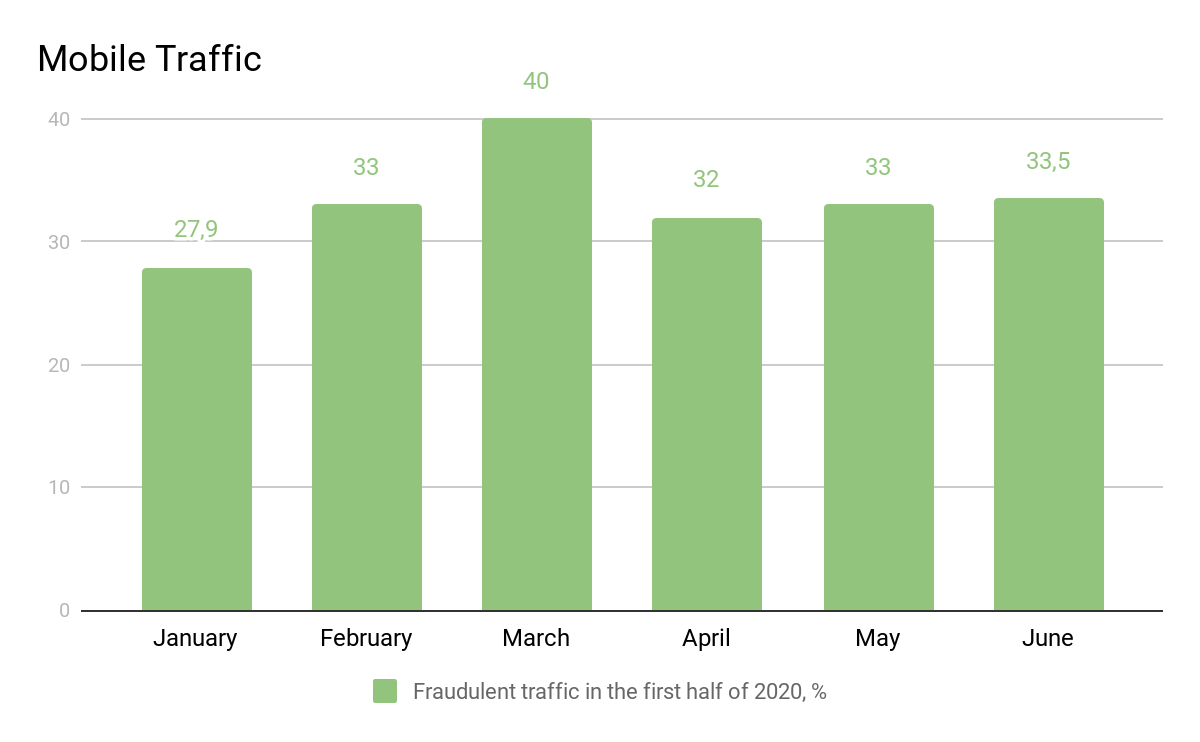
- We’ve ended 2019 with 31.42% of ad fraud in mobile traffic.
- And Jan-Jun, 2020 already had 34% of fraud in mobile.
- Numbers by months: in January 27,9%, February 33%, March 40%, April 32%, May 33% and in June 33,5%.
- As we can see, 2020 had more ad fraud in mobile traffic than we’ve seen at the end of 2019.
- March had the highest numbers (40%) — when the majority of global population went online and had spent all their days in front of the screen.
- A noticeable decreased happened in April (down to 32%). We think that users adapted to the new realities and kept on using both mobile devices and laptops (web) to browse the Internet.
- May and June with 33% are showing that people are slowly coming back to normal life — the share of web fraud decreased noticeably while mobile fraud reached the 33% and stayed the same during two months.
- The most fraudulent geos in mobile were Russia, APAC and EU.
- It’s worth mentioning that EU geo hasn’t been among the leaders of ad fraud since 2018 reports.
- Middle East is also producing more and more fraudulent traffic starting since April. In Q2 Middle East has already reached the number of 34% of fraudulent traffic. Marketers need to stay aware while campaigning in that geo.
Android traffic
- 35% of all processed Android traffic were fraudulent.
- 2020 started with 28% in January and has been gradually increasing up to 33,7% in June.
- Russia&CIS, EU and APAC — top three fraudulent geos for Android traffic. 45% for Russia, and almost the same number for EU and APAC — 36,9% and 36,5%.
- The most fraudulent app categories — Productivity&Tools as the leading category, then Games&Entertainment and News.
- Productivity has become a leading fraudulent category starting since May 2020.
iOS traffic
- 29,3% of iOS traffic were marked as fraudulent in Jan-Jun 2020.
- March and June had the highest numbers — 32% and 32,7%. January was the least fraudulent with only 27% of detected ad fraud.
- APAC, Middle East and India are the most fraudulent in iOS traffic with 31%, 29%, 28% respectively.
- Russia&CIS has an enormous pick in June — up to 46% of af fraud from iOS.
- The most fraudulent categories are: Games&Entertainment, Books&News and Sports&Health. The Sports&Health category has joined the top three fraudulent leaders in 2020, starting since February — with the beginning of pandemic.
- Both OSs still have a noticeably high share of ad fraud in Food Delivery app category (including cafes and groceries delivery). It looks like this trend will continue to develop as more and more people switch to home delivery of food rather than going to offline stores.
If you want to reach new GEOs and audiences, maybe it is all waiting for you on Telegram? We’ve prepared some material about Telegram audiences. What are the messenger’s users like this year? How old they are, what they do, and what they are interested in!
Web Traffic
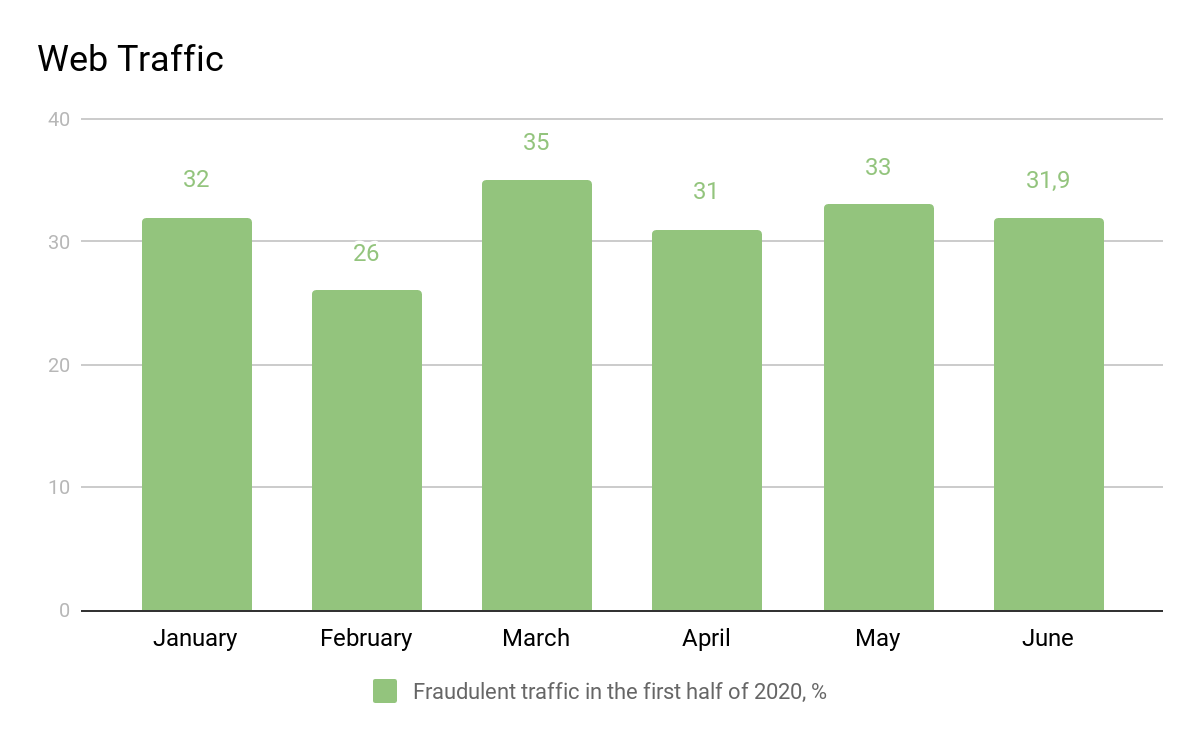
- At the end of 2019 — 33% of global web traffic were fraudulent.
- First six months of 2020 had a slight improvement in general — 31,5%. But if we take a look at monthly statistics, we see that the pandemic months had their fair share of detected ad fraud.
- March was the most fraudulent month for web campaigns. Users flooding the Internet while staying at home and fraudsters didn’t miss that opportunity.
- The June numbers show that more people had a chance to leave their houses and spent less time at the laptop. While web campaigns fraud decreased in June a little bit, the mobile ad fraud had the stable figure of 33%.
GEOs — global regions and detected ad fraud
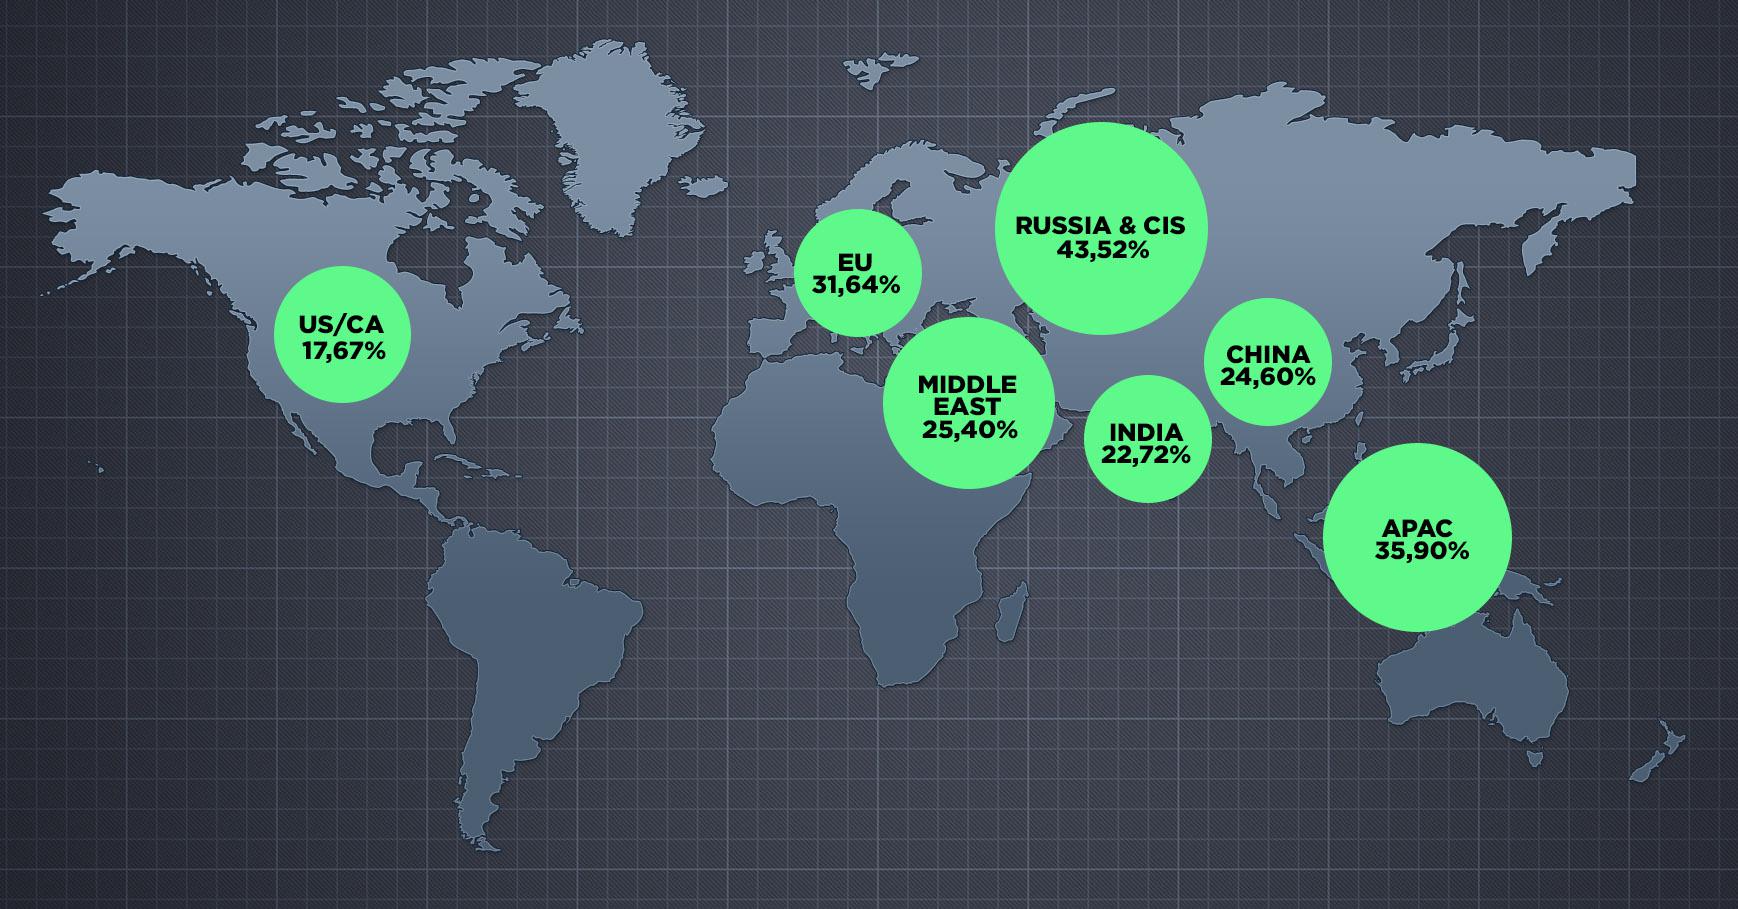
- In general, here are the statistics for the share of ad fraud divided by global geos in Jan-Jun 2020.
- Russia & CIS is the most fraudulent geo in 2020 already. The amount of detected ad fraud from this geo hasn’t been lower than 42% since February, with terrifying 49% in March and 48% in April.
- An interesting situation with EU geo — that one ended 2019 with only 22% of ad fraud, but starting since February 2020 the amount of ad fraud in EU geo has been growing up to 40% in March, and 30% in May and June. These numbers demonstrate that fraudsters in all EU has been powering up because all the EU countries were on lockdown, all the users were stuck at home browsing the web.
- China is starting to come back to global ad fraud map with higher % of fraud. There was a decrease at the beginning of 2020 — 19% of detected fraud, but starting since April — China traffic has been more fraudulent: 21%, 24%, 36% in the Q2.
Most detected Fraud types at the global market in Jan-Jun 2020
FraudScore statistics for Jan-Jun 2020 show that the most prevalent ad fraud types were Proxy fraud, Attribution fraud, IP-anomalies and Device fraud.
Proxy services have become widely popular among users all over the globe. Such services are used to get access to blocked resources, to be anonymous, to save traffic etc. Fraudsters are aware of that fact and turn their powers to use proxy as real users would do — they mimic almost every action that a real-life user does if he uses proxy.
Attribution fraud (click fraud) is one of the most popular ways to undermine campaigns. The reason is that it allows to steal real organic traffic — real users. Attribution fraud includes several different types:
- Click Spamming — when a real organic install is attributed to fraudsters. The fraud begins when a user opens a mobile web page or installs an app where a fraudster has already placed his trap. Such pages and apps are sending clicks in the background and user is never aware of that. If the user installs a new app or opens it by his own will — his install will be attributed to a fake click realized by the fraudster.
- Click Injection (specific for Android only) — usually realized via malicious apps that users have on their phone (Battery savers, File extractors etc). Such apps are tracking the actions of the user — when such user installs a new app, the malicious app generates a click and attributes a real install that the user did himself to a paid install. And the advertiser shouldn’t have paid for this install because it was a regular one, but the fraudsters made is a paid install.
- There is also an install/conversion fraud. When all the steps in the conversion funnel are completely generated by the fraudsters.
IP-anomalies and Device fraud are usually a sign of artificial traffic made by bots (bot farms, botnets etc). Emulators and bots are popular among fraudsters as they can easily imitate an active user, interact with ads and apps, and generate large amounts of traffic. In general, such fraud types are detected when a suspicious amount of “users” from one ad are coming from the same IP subnet or even have the same device IDs.
FraudScore algorithms analyze 150+ metrics to deep dive into traffic and detect suspicious fraudulent schemes. That approach allows FraudScore to be efficient with well-known types of fraud as well as with the new emerging ones. So we can say that even sophisticated fraud types can be detected by the ultimate antifraud solutions as FraudScore. You can always read more about FraudScore fraud reasons approach in the Knowledge base.
Most widespread ad fraud types divided by geos:
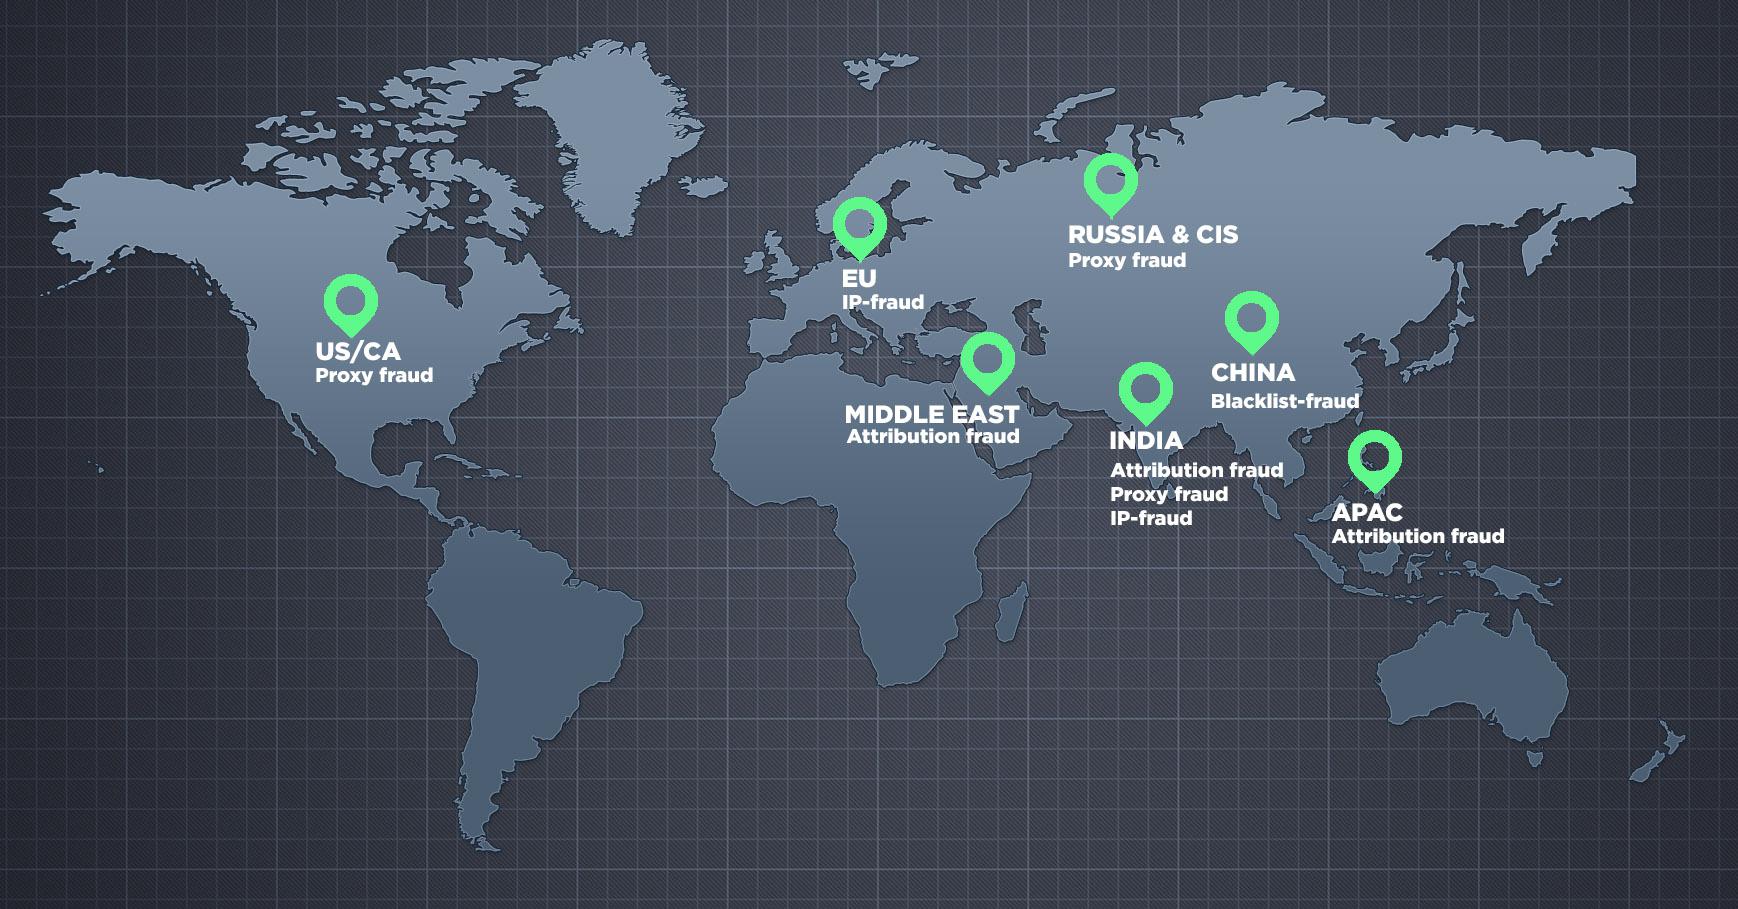
- Detected proxy fraud comes as the most widespread fraud type from the majority of geos. It means that fraudsters all over the globe are exploiting the wave of proxy services popularity among real users for their own benefit. But the highest amount of proxy fraud traffic come from USA&CA, Russia&CIS and India.
- India geo is also a known source for bot traffic and 2020 statistics verify that statement. One of the most detected fraud category in India is IP-fraud — the sign of bots, bot farms, emulators etc.
- The same goes for EU geo — IP fraud here is in the top three, but comparing with other global geo — IP fraud in EU is the top most detected type. Emulators, bots, bot farms are on the rise here posing threats to campaigns for this popular geo.
- When it comes to attribution fraud, globally it’s the second most detected fraud category. More and more cheaters are going for attribution because the users are real — fraudsters just need to trick platforms and steal real users actions (e.g. clicks). The most attribution fraud prone geos are APAC, India and Middle East. Not a surprise for marketers to keep a closer look at traffic originating from these geos.
- China has shown a high amount of Blacklist fraud — when traffic originates from sources that are widely known for fraudulent and malicious activities. Fraudsters keep using unreliable sources hoping to get to campaigns that are not protected by an antifraud solution and their bad traffic might not be noticed at all.
This is how the ad fraud landscape has been evolving recently. Hopefully, you haven’t suffered income-wise, but it is still worth always being on the lookout for new updates and tendencies. Thanks to guys from FraudScore for sharing their data and expertise with us.