
Fraudulent traffic is as old as the internet itself, or at least close to that. And every year someone makes money of it and somebody takes considerable loses. Once again we’ve gathered relevant info about fraudulent traffic and we are ready to share.
TrafficGuard/Juniper estimate that advertisers who run campaigns without protection stand to lose 26% of their investment to fraud
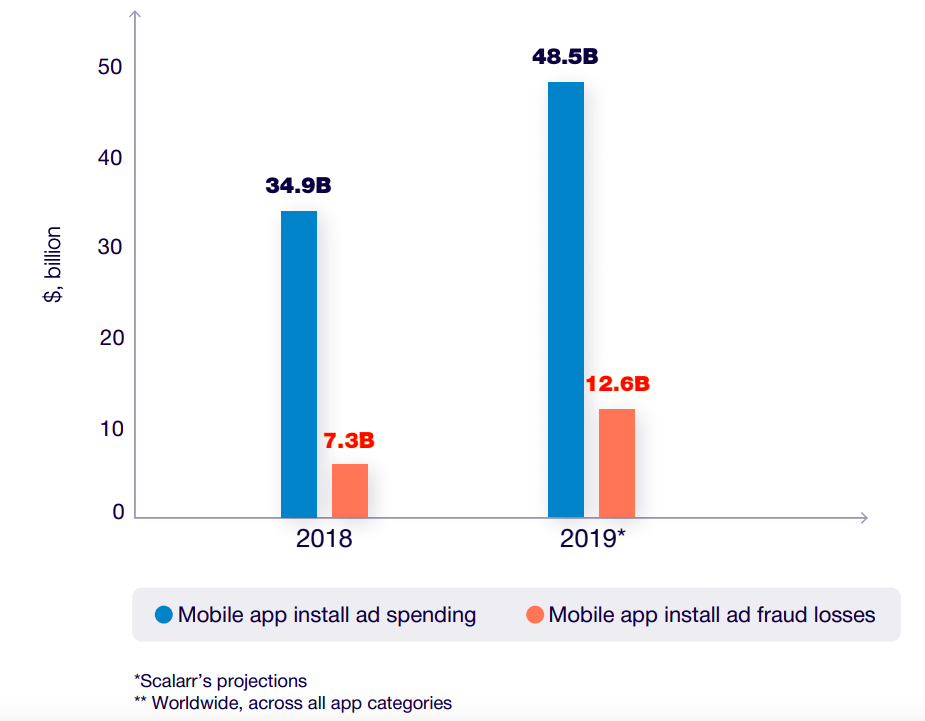
In 2019, app install fraud may cause losses of up to 12.6 billion or 26% of the total app install ad market:
Q1’s CTI ratio was 22:1, which is closer to expected human interactions with ads across connected devices and indicative of less fraud from click flooding. Last quarter, the overall CTI was 62:1. In Q3 2018, it was 52:1.
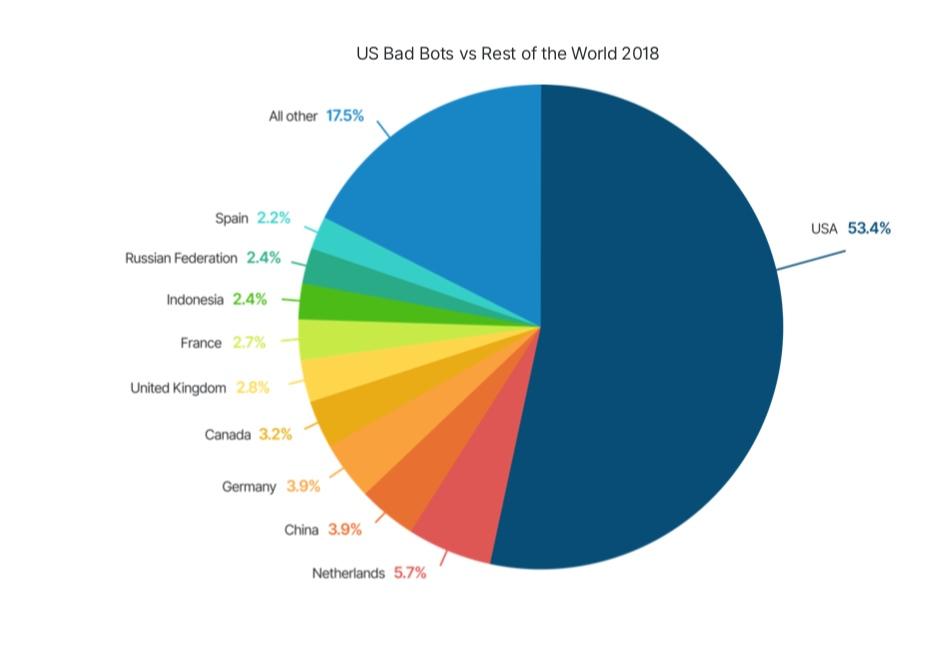
For the fifth year running, the United States topped the list of bad bot originating countries. It remains the only bad bot superpower, from which more than half (53.4%) of all bad bot traffic originates:
If you want to reach new GEOs and audiences, maybe it is all waiting for you on Telegram? We’ve prepared some material about Telegram audiences. What are the messenger’s users like this year? How old they are, what they do, and what they are interested in!